Jonghyun Ho
How to get stock data using Yahoo Finance Python API

yfinance 설치
$ pip install yfinance
yfinance 모듈 임포트하여 주식 데이터 읽기
>>> import yfinance as yf
>>> import matplotlib.pyplot as plt

>>> apple = yf.Ticker('AAPL')

# get stock info
>>> apple.info
{
    "zip": "95014",
    "sector": "Technology",
    "fullTimeEmployees": 137000,
    "city": "Cupertino",
    "phone": "408-996-1010",
    "state": "CA",
    "country": "United States",
    "companyOfficers": [],
    "website": "http://www.apple.com",
    "maxAge": 1,
    "address1": "One Apple Park Way",
    "industry": "Consumer Electronics",
    ...
    "regularMarketDayHigh": 282.65,
    "navPrice": null,
    "averageDailyVolume10Day": 28025537,
    "totalAssets": null,
    "regularMarketPreviousClose": 280.02,
    "fiftyDayAverage": 265.532,
    "trailingAnnualDividendRate": 3,
    "open": 282.23,
    "regularMarketPrice": 282.23,
    "logo_url": "https://logo.clearbit.com/apple.com"
}

>>> hist = apple.history(period='max')
>>> hist
              Open    High     Low   Close     Volume  Dividends  Stock Splits
Date
1980-12-12    0.41    0.41    0.41    0.41  117258400        0.0           0.0
1980-12-15    0.39    0.39    0.39    0.39   43971200        0.0           0.0
1980-12-16    0.36    0.36    0.36    0.36   26432000        0.0           0.0
1980-12-17    0.37    0.37    0.37    0.37   21610400        0.0           0.0
1980-12-18    0.38    0.38    0.38    0.38   18362400        0.0           0.0
...            ...     ...     ...     ...        ...        ...           ...
2019-12-16  277.00  280.79  276.98  279.86   32046500        0.0           0.0
2019-12-17  279.57  281.77  278.80  280.41   28539600        0.0           0.0
2019-12-18  279.80  281.90  279.12  279.74   29007100        0.0           0.0
2019-12-19  279.50  281.18  278.95  280.02   24592300        0.0           0.0
2019-12-20  282.23  282.65  278.63  279.44   29340716        0.0           0.0

[9840 rows x 7 columns]

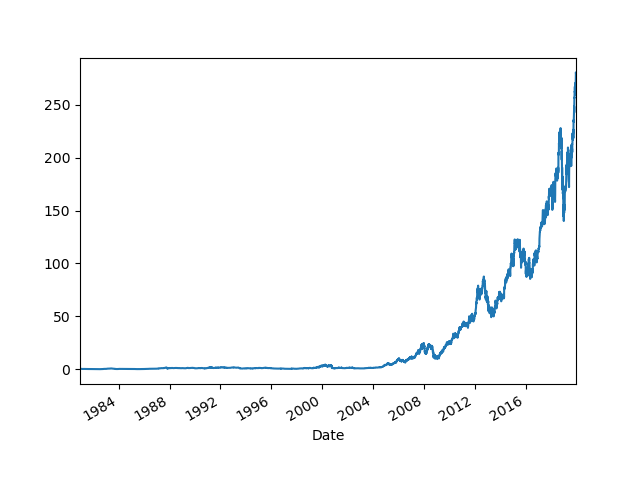
>>> hist.Close.plot()
<matplotlib.axes._subplots.AxesSubplot object at 0x0000029349520908>

>>> plt.show()

참조
Written on December 21st , 2019 by Jonghyun HoFeel free to share!